Debugging
Debugging lets you pause a running Feature File, step through it one step at a time, and inspect the state of your test as it runs. The Cycle Testing VS Code Extension builds on the standard Visual Studio Code debugging tools, so the controls, breakpoints, and panels behave the way they do for any other language in VS Code. The difference is that you debug CycleScript rather than a general-purpose programming language.
Debugging requires Cycle 2.29.0 or later and Cycle Testing VS Code Extension 1.18.0 or later.
Debugging is available for Feature Files only. You cannot debug playlists or group tests.
Why debug a Feature File?
Running a test tells you whether it passed or failed. Debugging tells you why.
- Pause at a point of interest: Stop execution on a specific step instead of watching the whole test run through.
- Inspect state as it happens: See the current value of every variable at the moment execution pauses.
- Follow the flow across Scenarios: Trace how one Scenario calls another and how execution returns.
Launching a debug session
A debug session runs the entire Feature File.
Start debugging in any of these ways:
- Press
F5while the Feature File is the active editor tab. - Run Debug Feature from the Command Palette.
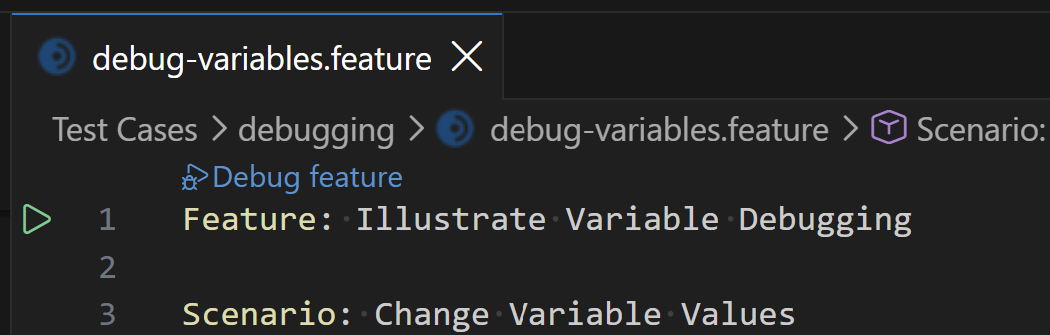
- Click the Debug feature CodeLens that appears above the
Featureline.
No launch configuration is required.
You do not need to create or edit a launch.json file before debugging.
A debug session does not stream output to the Test Results tab or to the Cycle Report Dashboard. Both are populated by normal execution only. See Executing Cycle Tests.
Controlling execution
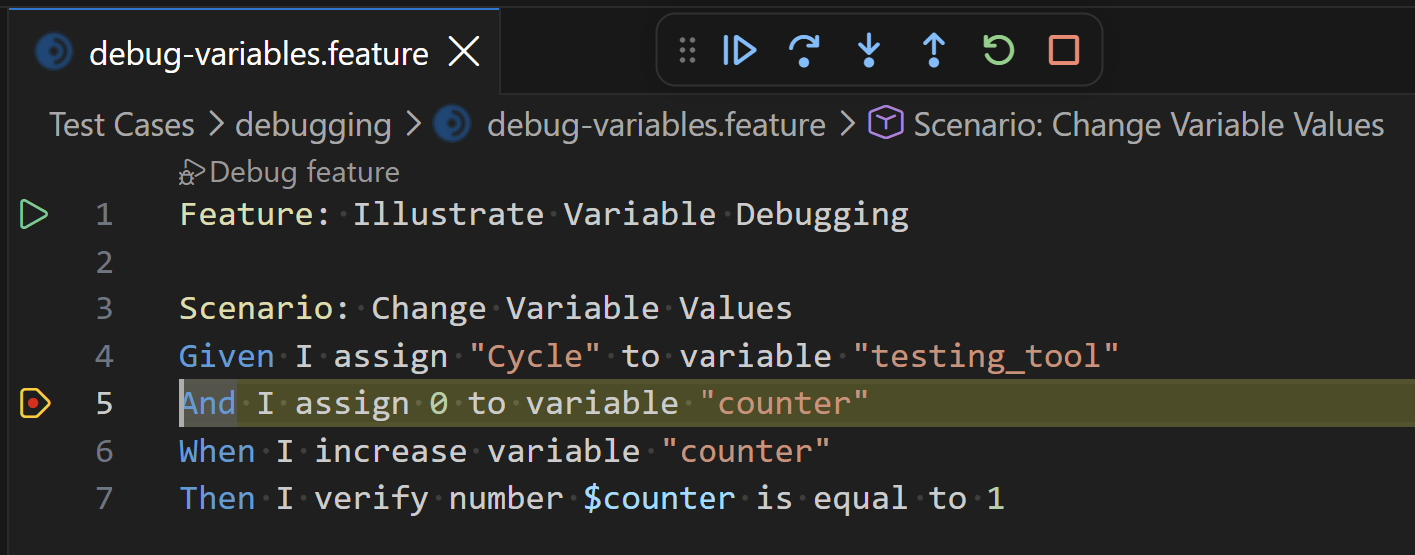
When execution pauses on a breakpoint, the VS Code debug toolbar becomes active. Breakpoints and stepping operate on steps, so each action advances execution by whole steps.
The toolbar supports every control:
- Continue: Resume execution until the next breakpoint or the end of the test.
- Step Over: Run the current step and pause on the next step in the same Scenario.
- Step Into: Enter a called Scenario. In CycleScript,
I execute scenario "..."behaves like a function call, so Step Into descends into the called Scenario and pauses on its first step. - Step Out: Finish the current Scenario and return to the step that called it.
- Restart: Stop the current debug session, then start a fresh one from the beginning of the Feature File.
- Stop: End the debug session. Cycle closes the execution session and all supporting resources.
Setting breakpoints
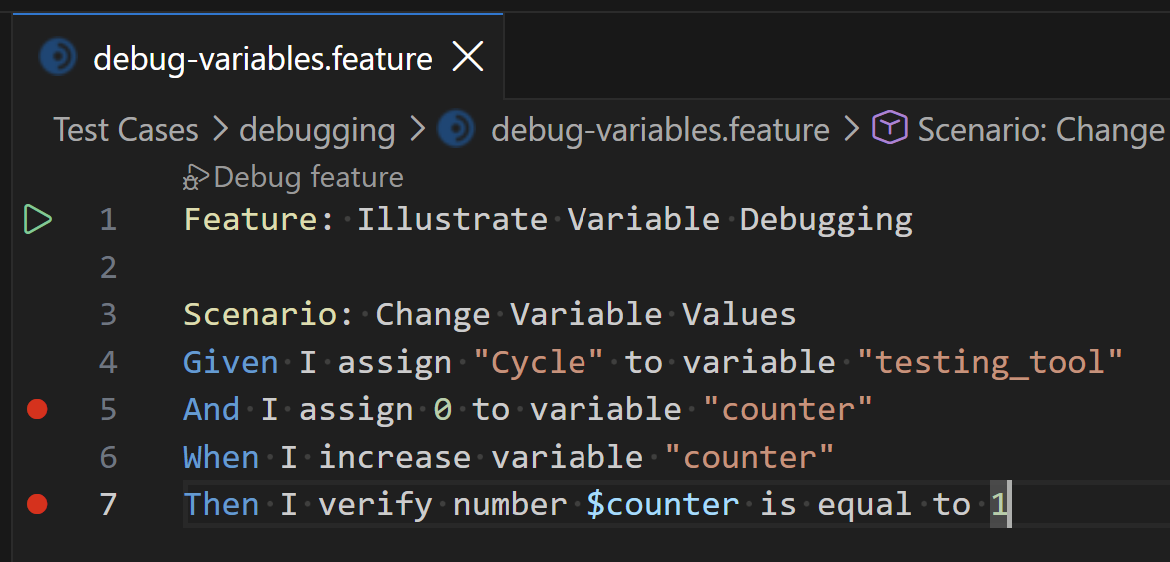
A breakpoint marks a step where you want execution to pause.
- Click the gutter to the left of a step, the same way you would in any VS Code editor.
- Confirm that a red dot appears to indicate an active breakpoint.
You can set breakpoints on steps only.
The gutter still accepts a breakpoint on a non-step line, such as the Feature line, a Scenario line, a comment, or a blank line.
That breakpoint is ignored when the Feature File runs.
Execution does not pause there, and the breakpoint does not move to the nearest step.
You can disable a breakpoint without removing it, then enable it again later. Manage all breakpoints in the current workspace from the Breakpoints section of the Run and Debug view.
Cycle does not support the following breakpoint types:
- Conditional breakpoints and logpoints
- Data breakpoints
- Function breakpoints
- Hit count breakpoints
Inspecting variables and the call stack
While execution is paused, the Run and Debug view shows the current state of the test.
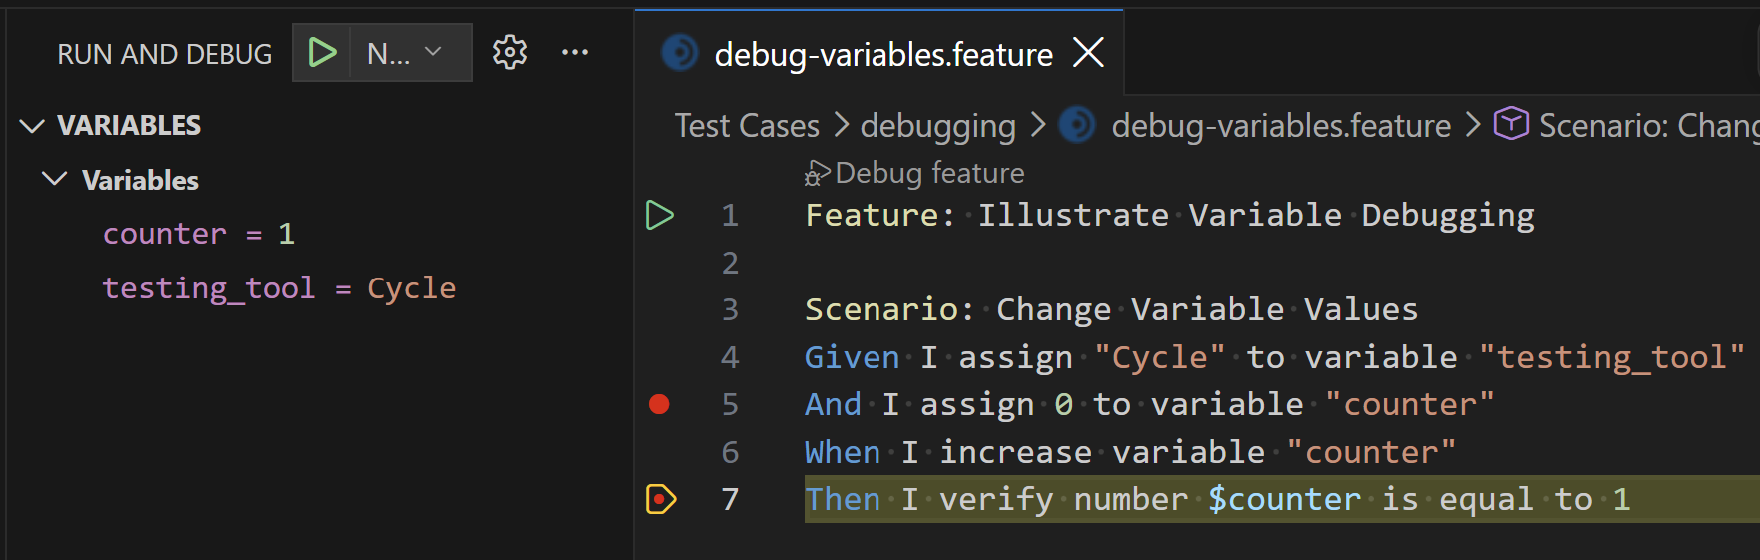
Variables
The Variables section lists every variable currently defined, along with its value. CycleScript uses a single, top-level Scenario scope, so all variables appear together in one Variables scope rather than being grouped into locals and globals.
Values are read-only. You can inspect a variable while execution is paused, but you cannot change its value from the Variables section.
Call stack
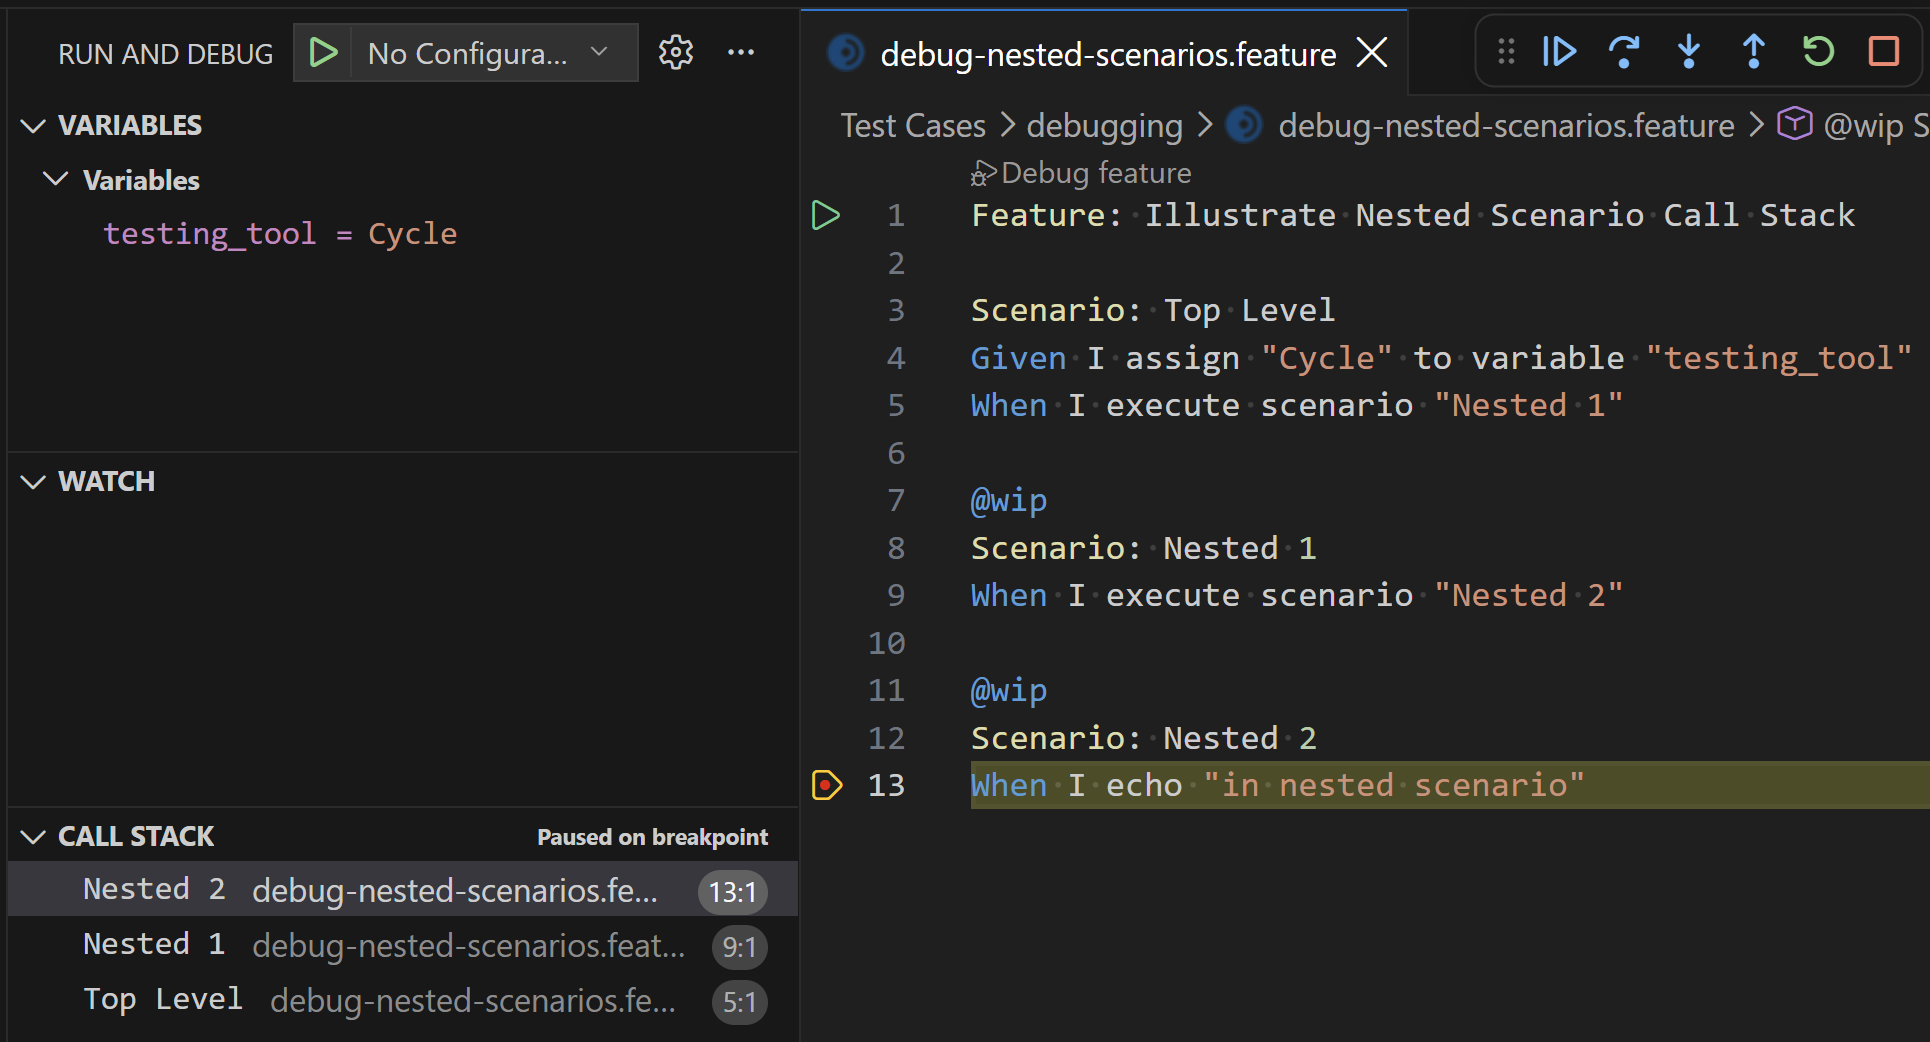
The Call Stack section shows the chain of Scenarios that led to the current step. Each frame corresponds to a Scenario. Cycle lists frames from deepest to shallowest:
- Top of the list: The Scenario that contains the current step.
- Bottom of the list: The top-level Scenario that started the test.
- Frames in between: Scenarios called through
I execute scenario "...". See Reusing Scenarios.
Each frame shows the Scenario name, the Feature File, and a position in that file.
For a calling Scenario, that position is the I execute scenario "..." step it is waiting on.
Select a frame to show the variables and source location for that Scenario.
Pausing on failing steps
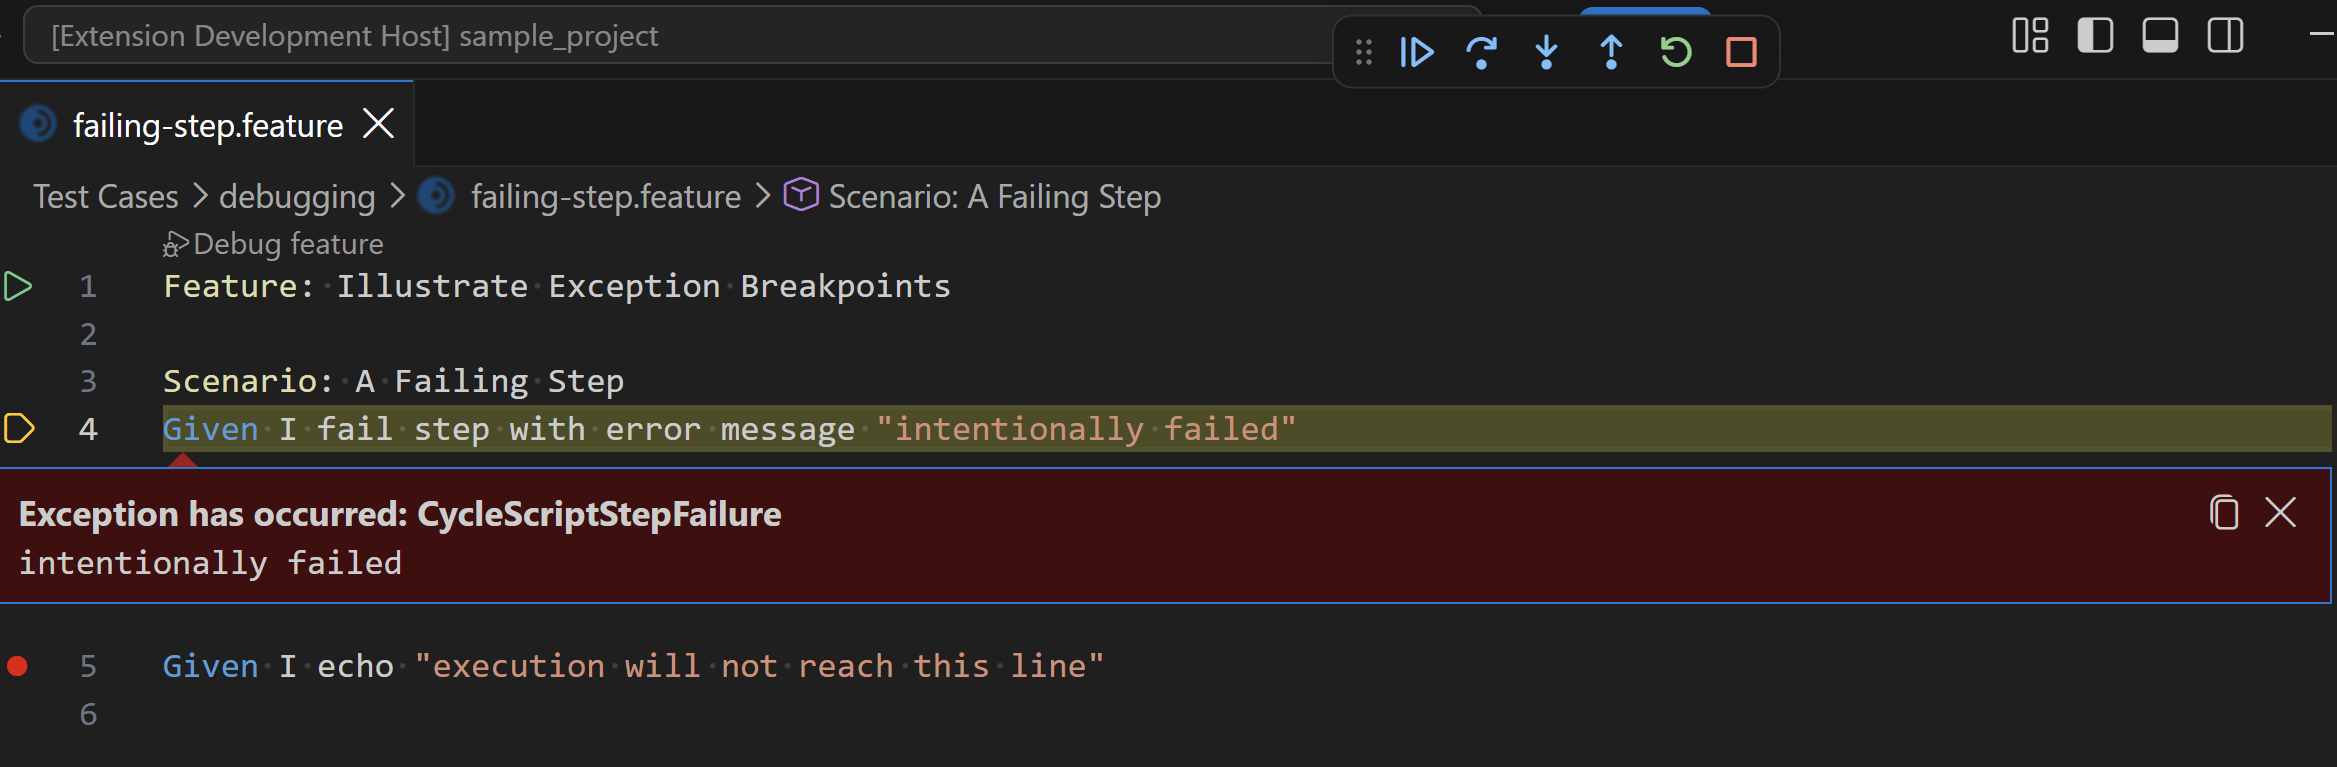
Execution pauses automatically when a step fails, without you having to set a breakpoint on that step in advance. In CycleScript, an error surfaces as a failing step, so this is the equivalent of breaking on an exception.
This behavior is always active. The Breakpoints section of the Run and Debug view does not offer exception breakpoint options to configure.
When execution pauses on a failing step, you see the failing step highlighted in the editor, with a red panel open directly beneath it.
The panel is headed Exception has occurred: CycleScriptStepFailure and shows the error message reported by the step.
Use the copy button to copy the failure details, or the X button to close the panel.