Inspector Panel
The Inspector panel, found on the right side of Cycle, uses a three buttons to show the Step Assistant (when editing a Feature), Settings and Output.
![]()
This panel aslo has 2 buttons in the lower left corner for the Data Extract tool and Collapse to hide the panel from view.
![]()
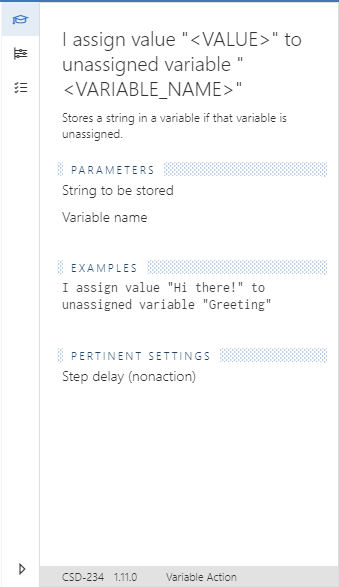
Step Assistant tab
The Step Assistant tab is designed to give additional information about the use case, parameters, and syntax of the highlighted step. In the example below, the Step Assistant is showing information about the Step: I assign "<VALUE>" to variable "<VARIABLE_NAME>".
Settings tab
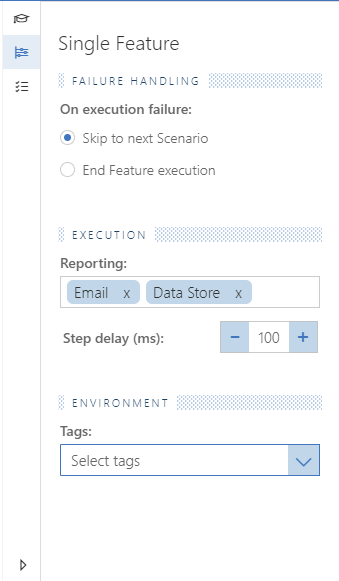
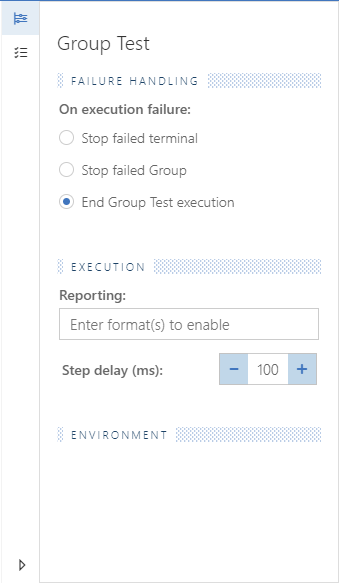
The Settings tab of the Inspector panel contains settings that are specific to the type of file open in the Cycle Editor. Below are examples of the Settings tab for each type of test. Settings configured here will override any of the same settings configured under Edit > Preferences.
In general, the Settings tab contains the subsections:
- Failure Handling - What Cycle should do if a Step fails.
- Execution - What type of reports to enable (Email or Web), and how much time to pause between Steps.
- Environment - Defines the specific Tags to be executed.
Feature Settings
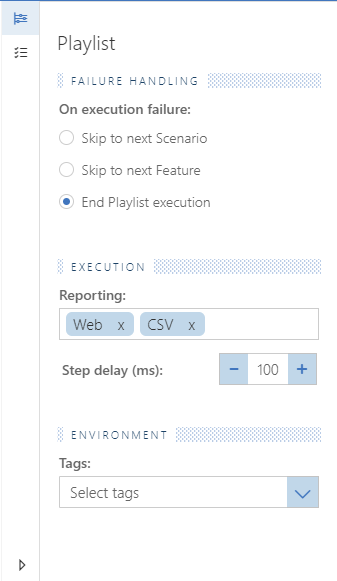
Playlist Settings
Group Test Settings
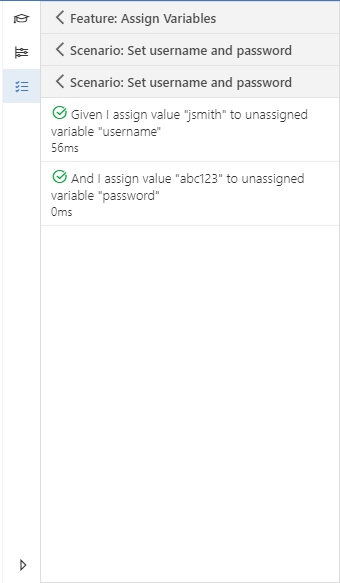
Output tab
The Output tab shows the results of a test that is currently running or has completed. A green check indicates success or "true", a red X indicates failure, an orange exclamation point indicates "false", and rotating arrows indicate a Step is currently running.
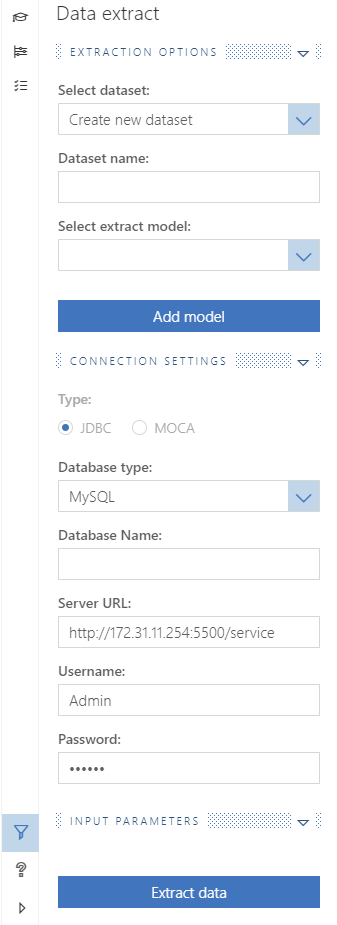
Data Extract tab
The Data Extract tool allows you to easily create CSV files from an existing database. The Extract Data window can be accessed via the "Tools > Extract Data..." menu item in Cycle. It can also be accessed from the Inspector panel with the funnel-shaped button.