Executing Cycle Tests
You execute Cycle tests from the Test Explorer view or from the file editor tab.
Test Explorer View
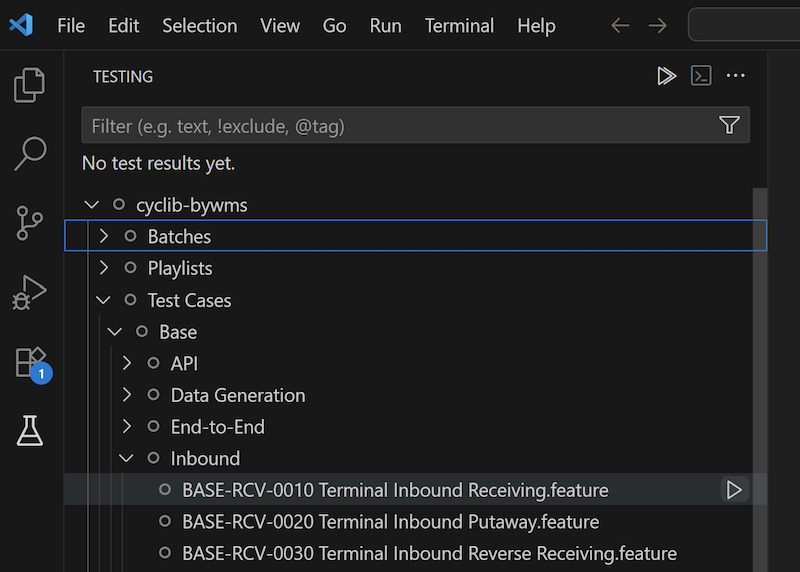
Once the Cycle extension has loaded, the Test Explorer will be available in the sidebar. The Test Explorer shows all tests in the Cycle project in a tree view.

You can execute a single test by clicking the Play icon next to a selected test.
You can execute multiple tests in sequence by selecting multiple tests with SHIFT+click or CTRL+click and clicking the Play icon.
Filtering Tests
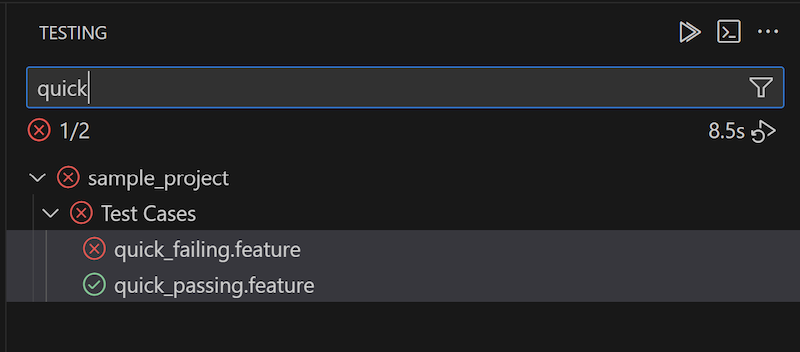
Tests can be filtered by name in the Test Explorer.

Editor Tab
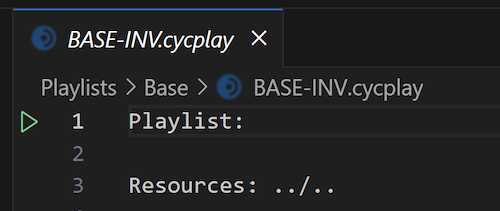
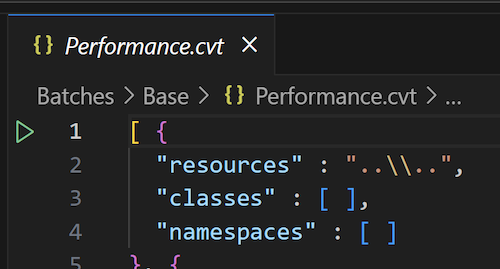
Tests can be executed from the Editor tab. An execution button will be displayed in the gutter next to the Feature line for features, the Playlist line for playlists, and the first line of the file for batch tests.


Test Results in VS Code
Test output is streamed to the Test Results tab in the Panel. The Test Results tab has a split view, which shows the streamed output on the left, and the execution history on the right.

Cycle Report Dashboard
The Cycle VS Code Extension streams test results to its own instance of the Cycle Report Dashboard.
Commands are available to open the Cycle Report Dashboard and restart it.

When you execute a test for the first time after opening a project, a prompt will display in the bottom right corner of VS Code inviting you to open the Cycle Report Dashboard.

The VS Code instance of the Cycle Report Dashboard will store results until you delete them. It persists results in the Cycle app data directory at C:/Users/<your-user>/AppData/Roaming/Cycle/results-vscode.db.
You can delete individual test runs through the Report Dashboard UI.
![]()
You can delete all stored results by running the command Clear Report Dashboard results.
