Viewing Test Results
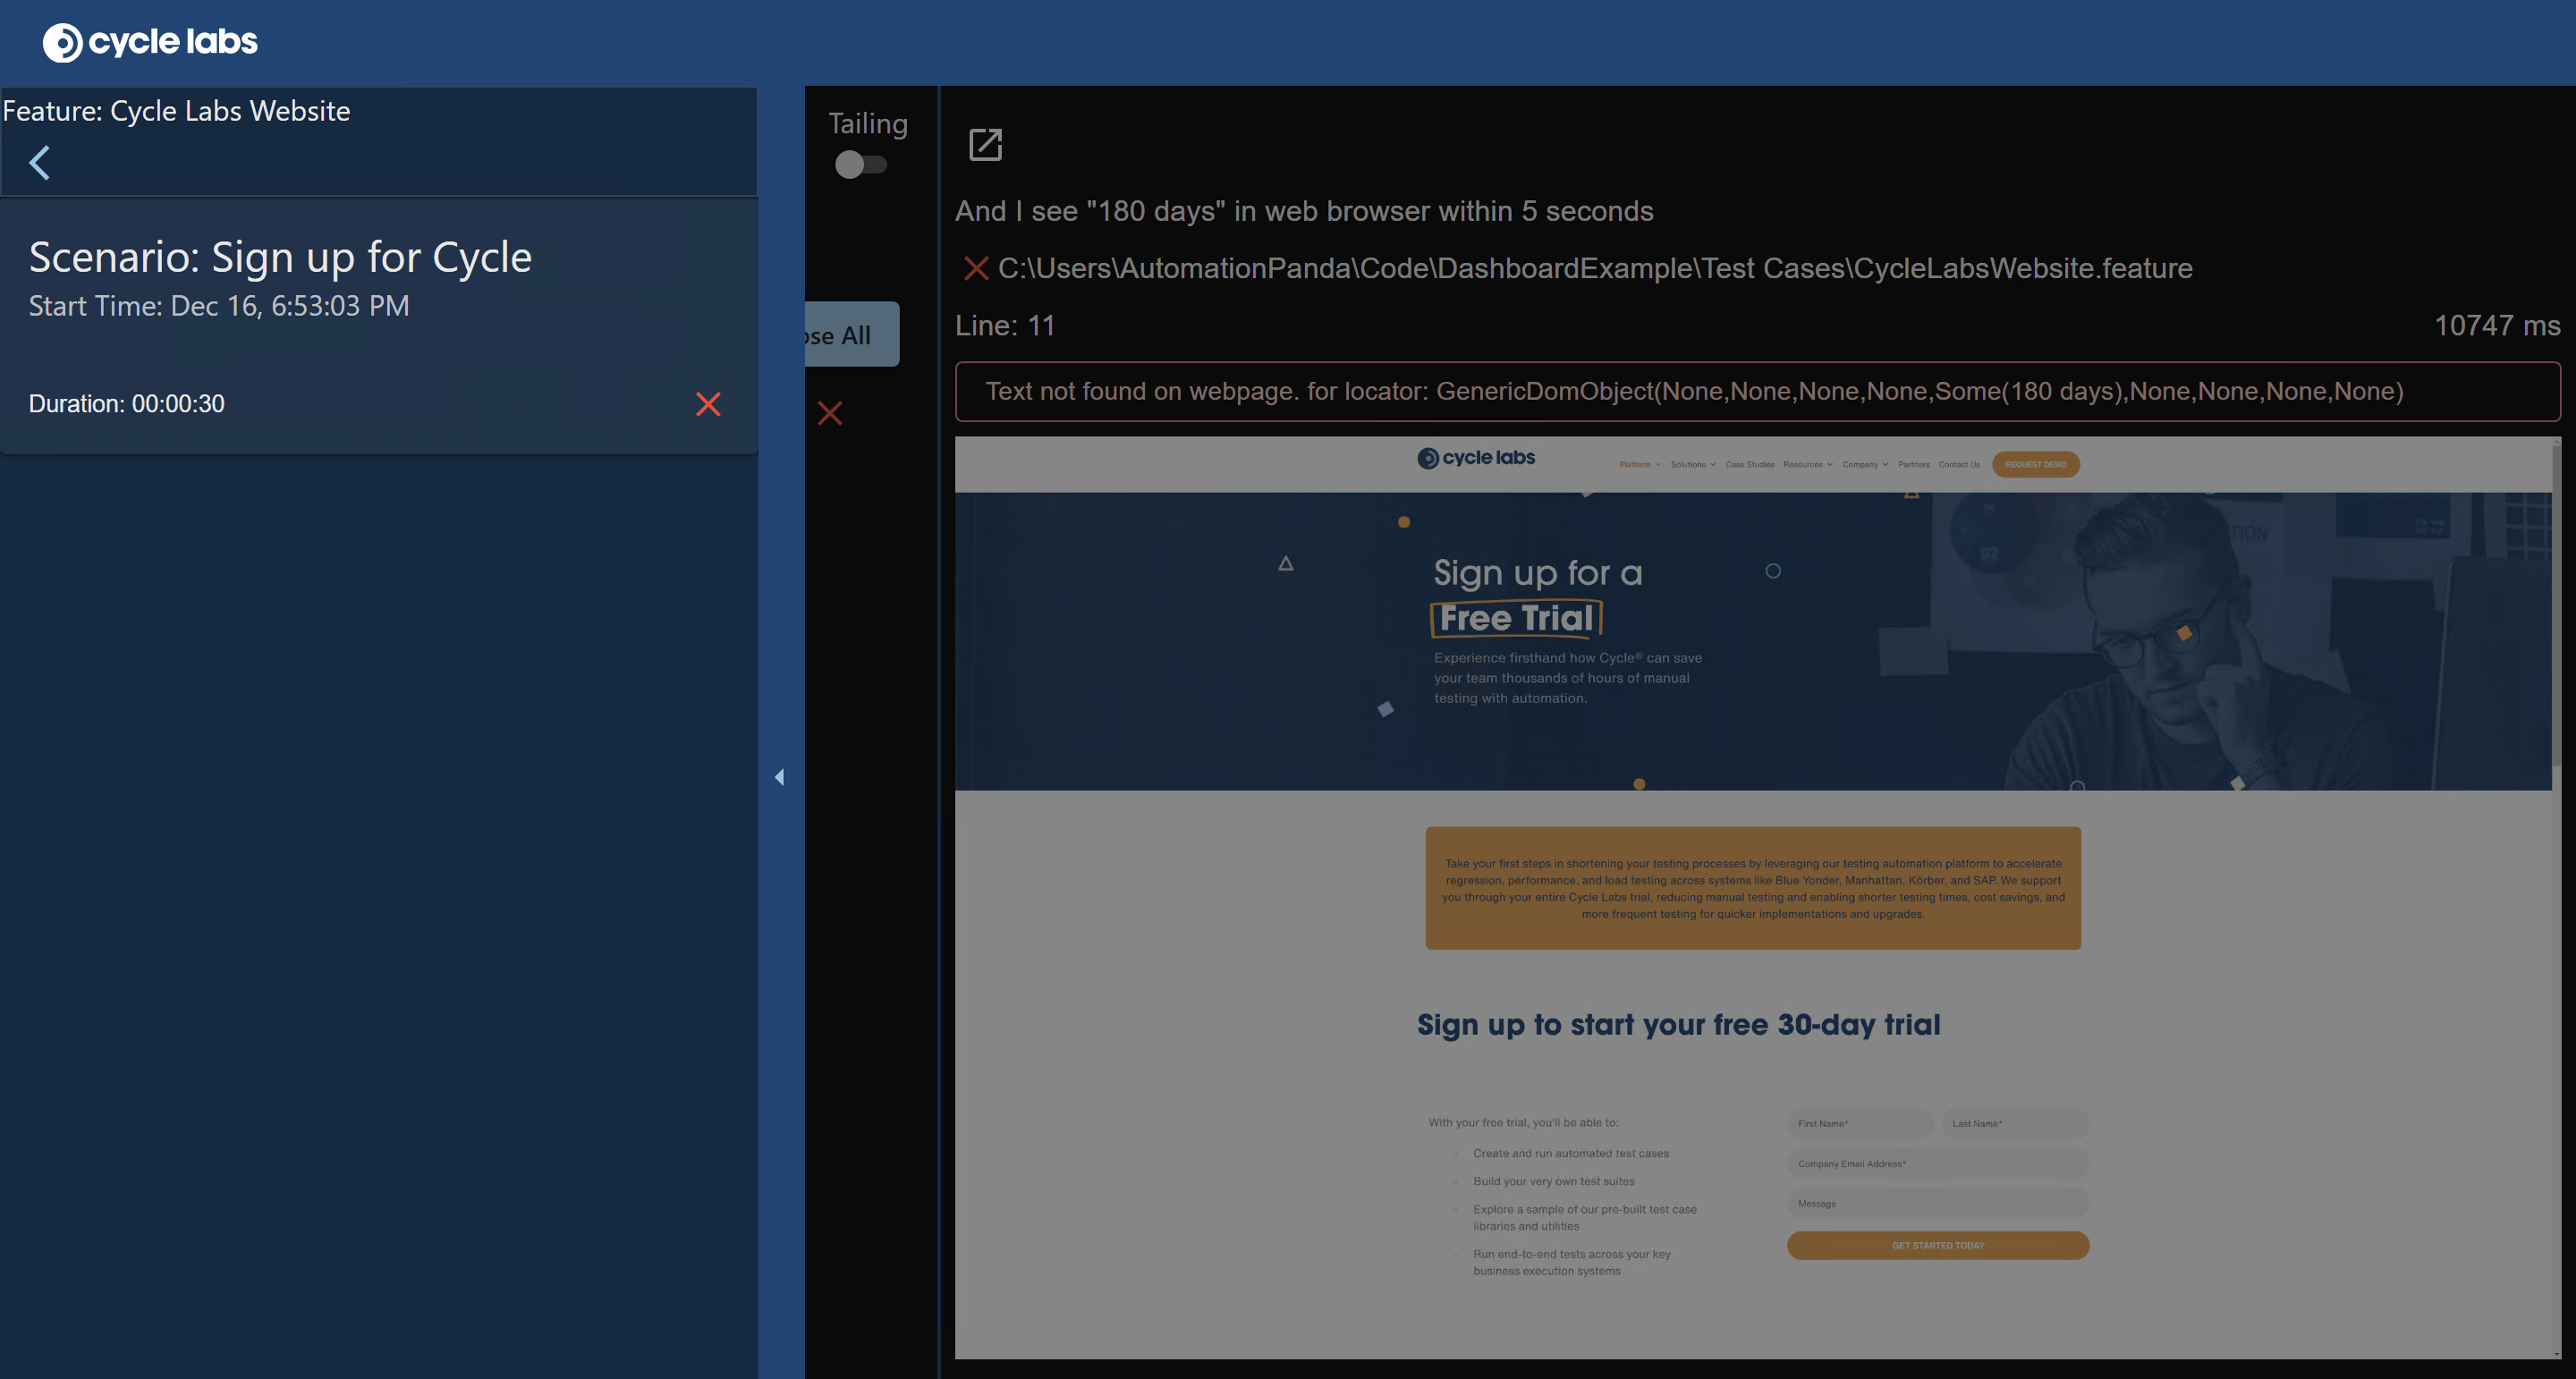
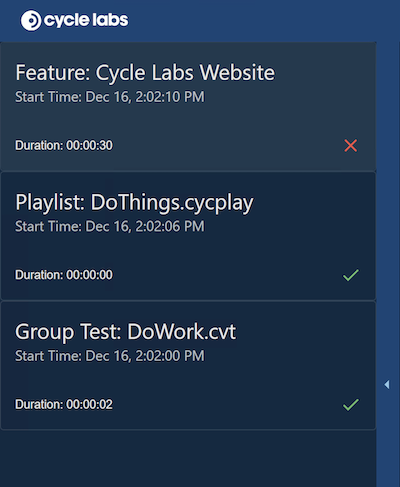
The Cycle Report Dashboard displays test results while tests are running as well as after tests have completed. It presents test launch summaries through a navigation sidebar. Testers can drill down through the sidebar to pick a specific test case, and the dashboard presents a detailed view for it.
Viewing test runs
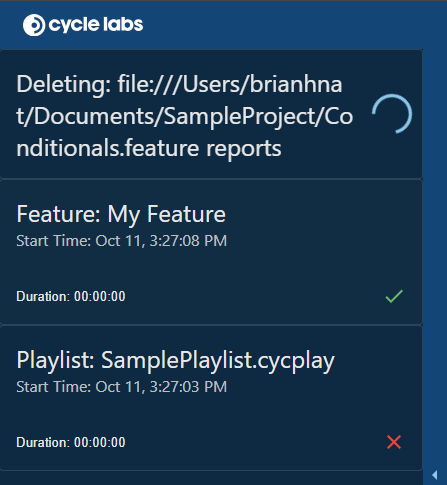
The navigation sidebar on the left displays test launches for all Cycle test types: Feature Files, playlists, and group tests. It presents them from top to bottom in reverse chronological order of their start time. Each test run card shows the test name, start time, duration time, and final result. A green checkmark indicates a passing result, while a red X indicates a failure.
Navigating to children
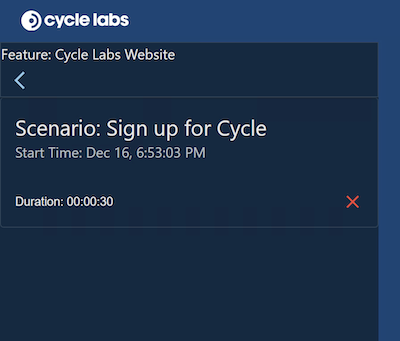
When selecting a card by clicking it, the navigation sidebar updates to show all the test's children.
- A Feature File shows all its Scenarios.
- A playlist shows all its Feature Files, which in turn show their Scenarios when selected.
- A group test shows all its groups, then workers, and finally Scenarios.
The example below shows the selection of a Feature File with one Scenario. The card for each child shows its test name, start time, duration time, and final result. The sidebar title displays breadcrumbs for the navigation path.
Deleting old or unneeded results
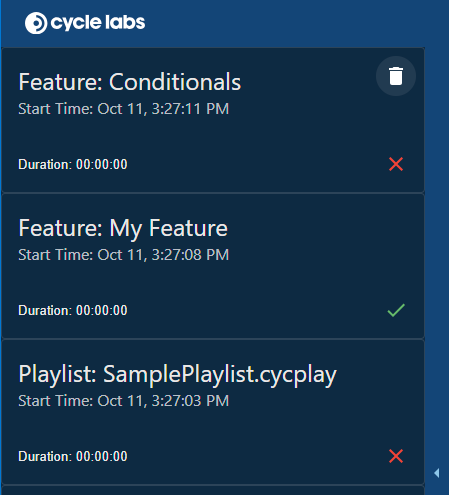
When running multiple tests or running tests multiple times, the sidebar can become congested with data that is no longer required. For this case, a trash can icon appears on top-level cards upon mouse hover that lets you remove the test run card, all children, and any stored results data on disk.
Upon clicking the trash can icon, Cycle prompts with a popup dialog to ask for confirmation before continuing to delete. Ensure you are deleting the proper test, as once deletion occurs the data is completely removed from the system. Upon accepting this dialog by clicking Yes, the card shows a deleting state. Navigation of the app is returned to the client and, even on a reload, the deletion status icon continues to show until the test run is deleted.
Viewing Scenarios
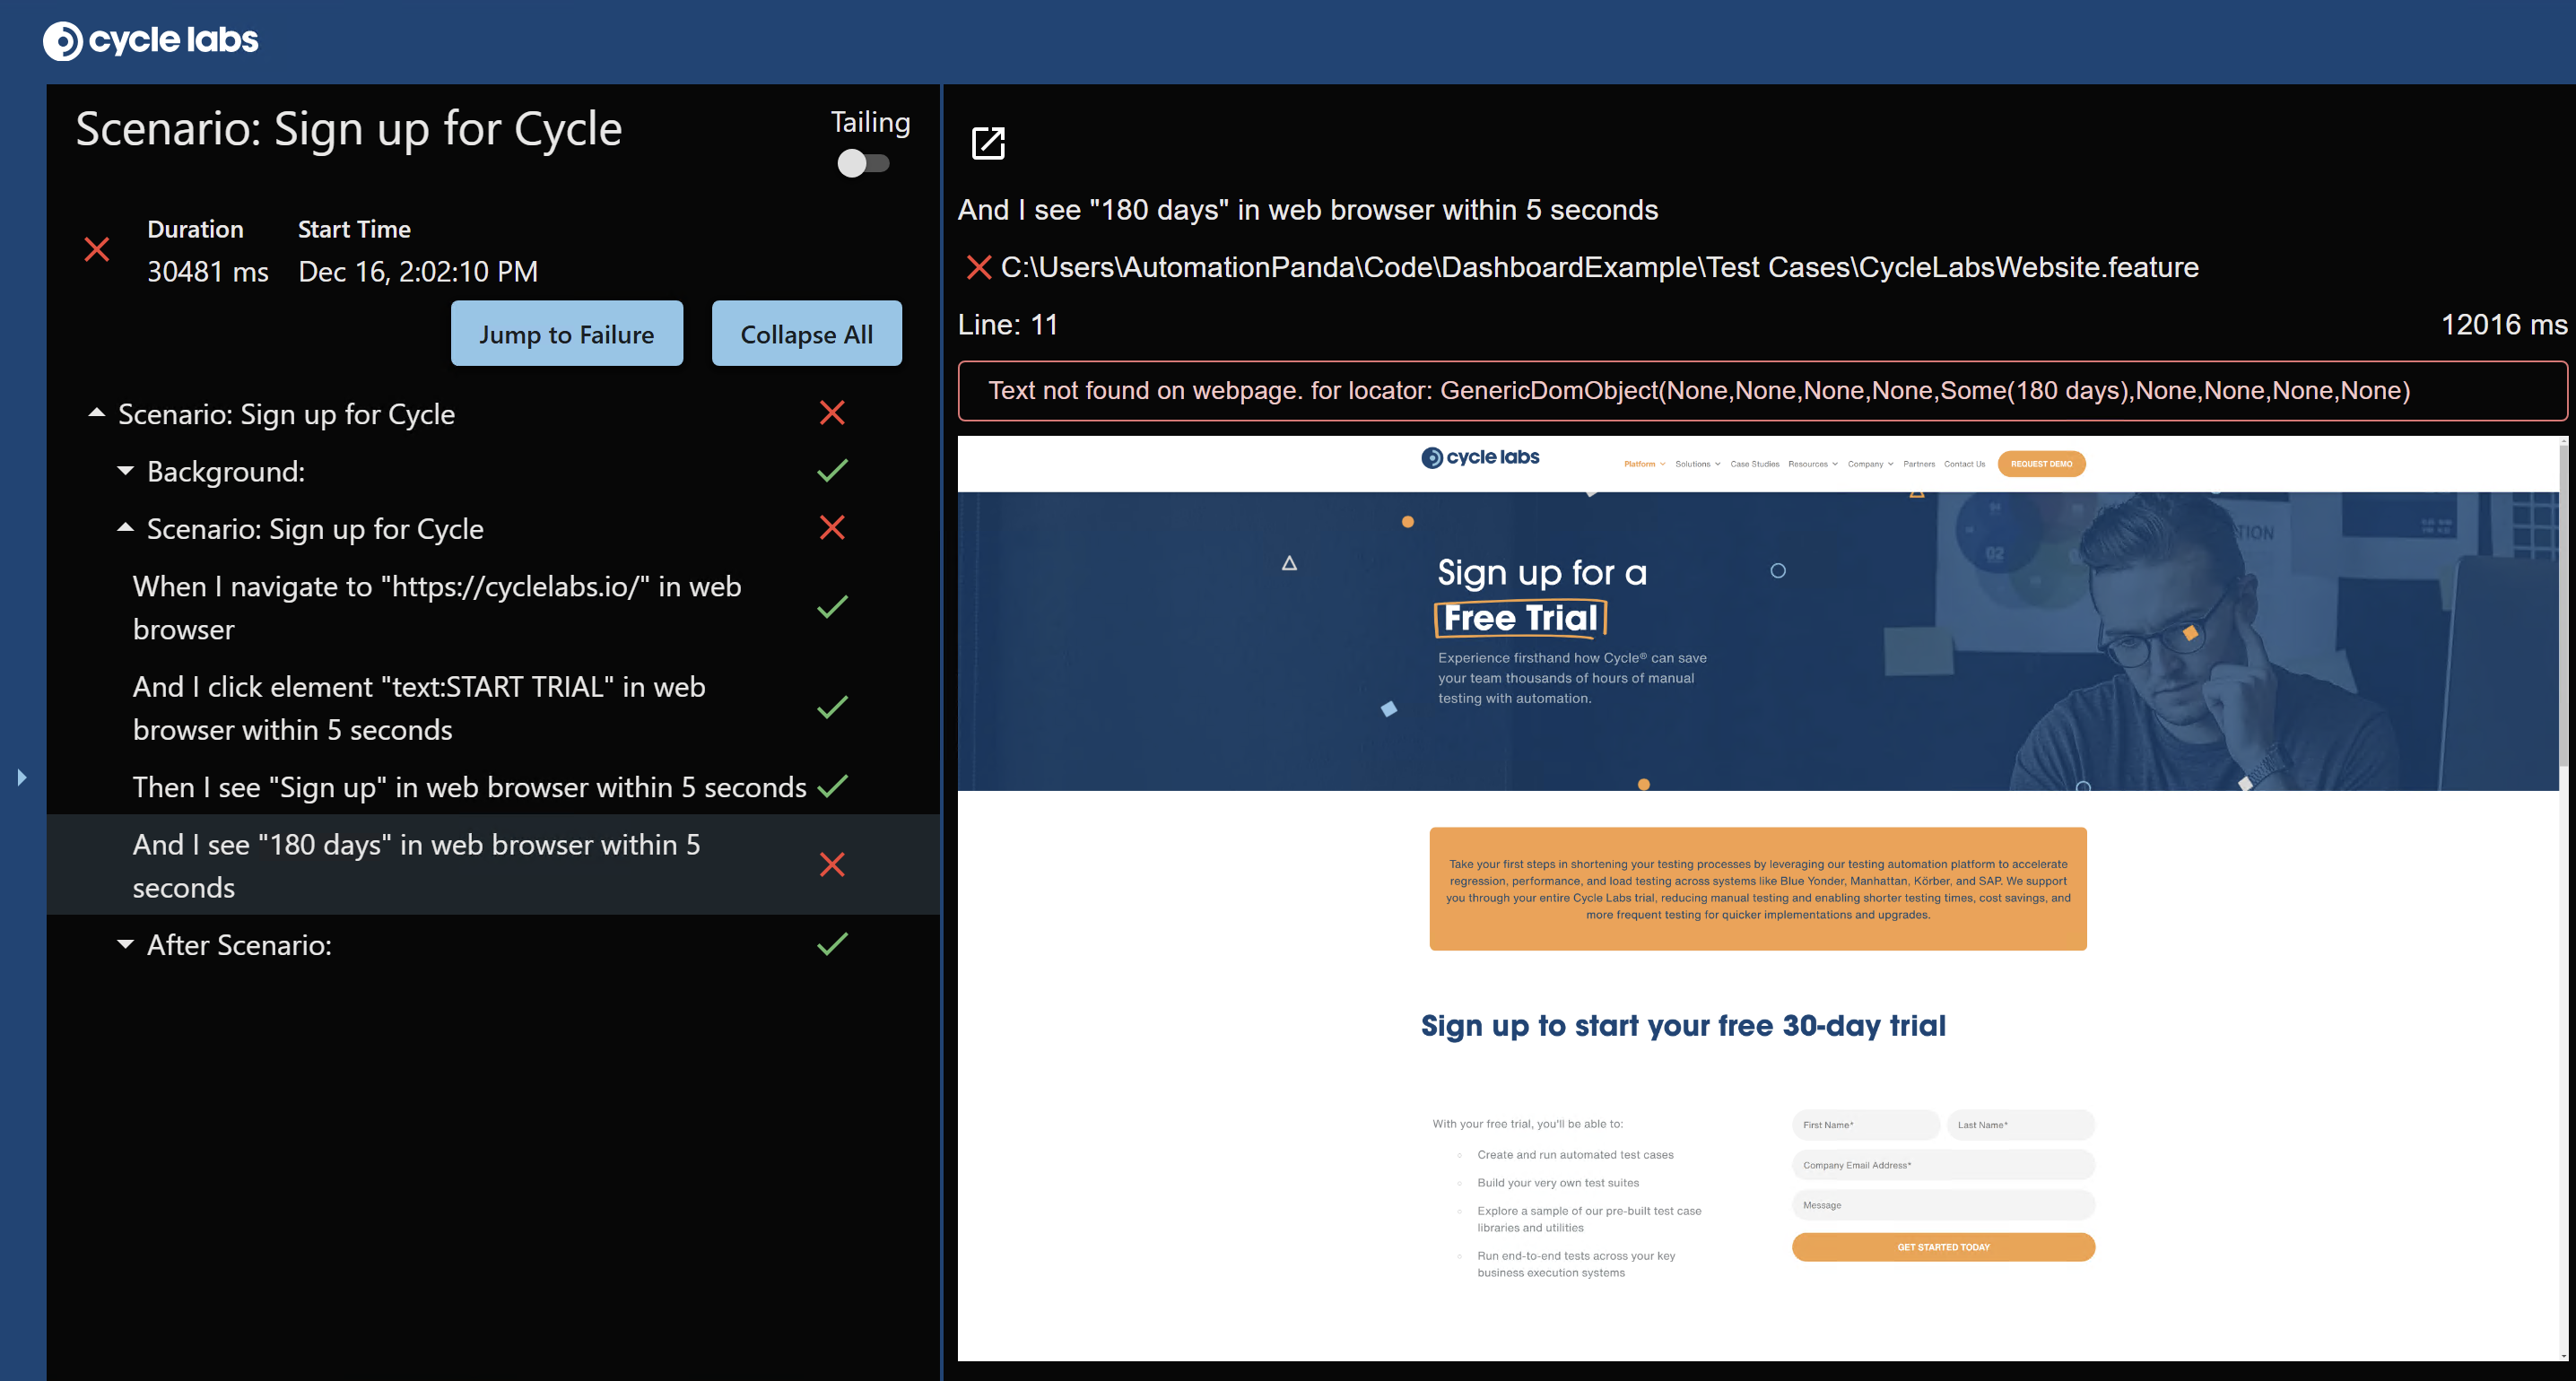
Scenarios are the terminal nodes for navigation. When a tester selects a Scenario, the navigation sidebar automatically collapses, and the dashboard displays the detailed results for the Scenario. In the Scenario view, the left column displays the overall Scenario result with a step-by-step trace, and the right column displays information about the selected step.
Scenario results and trace
The left column displays the results for a Scenario, including:
- The Scenario's name
- The Scenario's result status
- The Scenario's duration time
- The Scenario's start time
- An expandable tree view of all the Scenario's steps, with result status icons for each step
Tailing
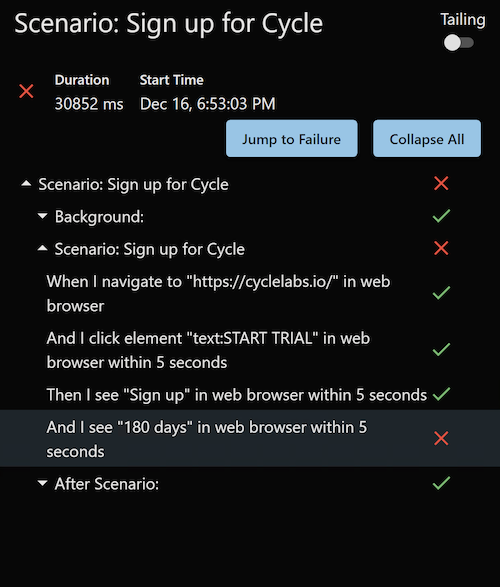
The Tailing option is displayed in the upper-right corner of the center column. If this option is enabled, then while a test is running live, the dashboard puts focus on the most recent steps completed as if it is tailing a log file. This option is helpful for tracking real-time status of a test as it runs.
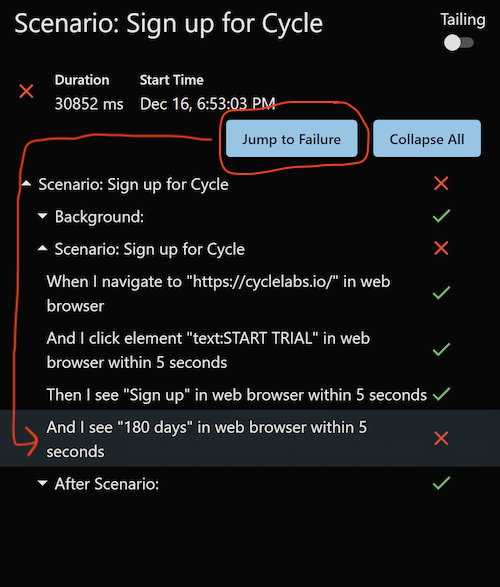
Jump to Failure
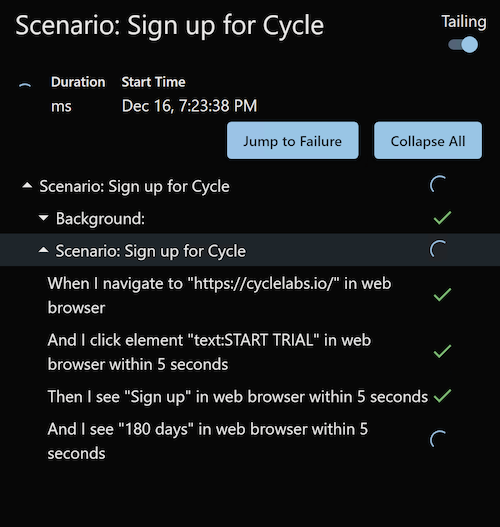
The Jump to Failure button is displayed in the upper-right corner of the center column underneath the Tailing option. If the Scenario has a failure, then when this button is clicked, the dashboard expands the tree view of the steps to focus on the failing step. Jumping directly to the failing step is more convenient than manually navigating through steps to find the failure.
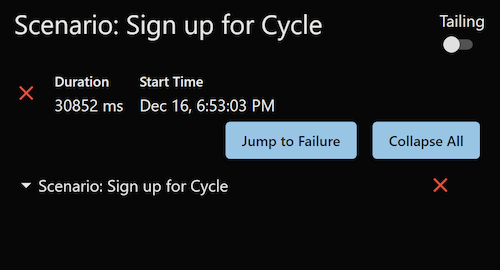
Collapse All
The Collapse All button is displayed in the upper-right corner of the center column directly to the right of the Jump to Failure button. When this button is clicked, the tree view for steps is fully collapsed.
Viewing steps
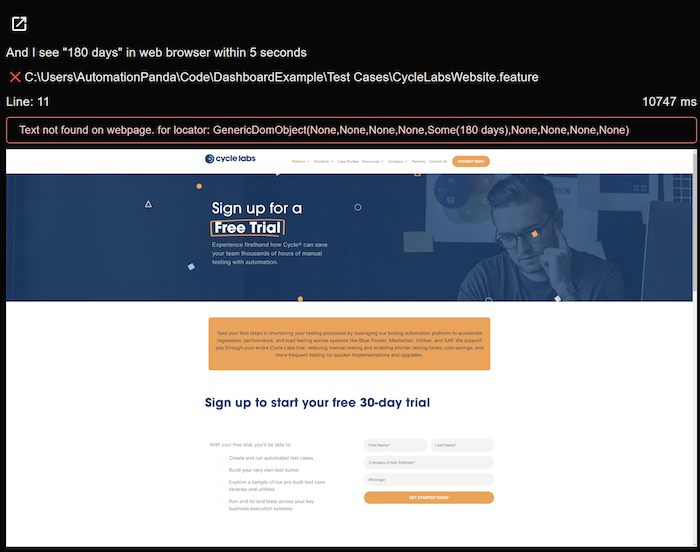
The right column displays information about a single step. To view a step, select it from the Scenario's list of steps. Step details include:
- The step's text
- The absolute filepath to the Feature File containing the step
- The line number in that file where the step appears
- The step's duration time
- If the step used any variables, a table of variable names and values
- If the step failed, the error message for the failure
- Any screenshots the step captured
Step result details
The rightmost column may appear to be narrow, depending upon screen sizes. You can view Step Result Details in a wider modal by clicking the pop-out icon in the upper-left corner of the column.
Navigating to other results
When a Scenario is selected, the dashboard automatically collapses the navigation sidebar to the left to give as much space as possible for displaying Scenario results. To expand the navigation sidebar again, click the thin blue column on the left. Then you can navigate through test run cards again to find the next tests you wish to view.